The genebank collections of the crop wild relatives (CWR) of the world’s major crops are incomplete, and the gaps in these collections represent limitations on the options available to researchers and breeders to study and introduce new diversity into their programs. At the same time, many CWR are threatened in the wild by habitat modification, the modernization of agricultural areas, and invasive species, among other factors, and climate change is likely to exacerbate their vulnerability.
To identify high priority locations for collecting CWR in order to fill the gaps in genebank collections, we compared data on the distributions of these species with the locations where the species have already been collected. Results, methodologies, and additional resources are presented on this page. The CWR species included in this assessment are listed in our Inventory, and our Global Atlas displays results for each CWR species and crop genepool, as well as a global summary. With contributions from experts in the field, the results of this “gap analysis” will inform the priorities for collecting CWR over the coming years.
Gap Analysis Results:
Gap analysis results have been completed for nearly 1,100 CWR species in 81 important crop genepools. Results include prioritization assessments for all species, and maps displaying distributions, patterns of richness, country level priorities, and areas worldwide where CWR are particularly in need of collecting for conservation and in order to be made accessible for research and breeding efforts. This page will present the results of the gap analysis work.
Crop Common Name |
Crop Scientific Name |
Number of CWR Assessed |
| Acorn Squash | Cucurbita pepo L. subsp. pepo L. | 8 |
| Adzuki Bean | Vigna angularis var. angularis (Willd.) Ohwi & Ohashi | 12 |
| Alfalfa | Medicago sativa L. | 13 |
| Almond | Prunus dulcis (Mill.) D. A. Webb | 30 |
| Apple | Malus domestica Borkh. | 33 |
| Apricot | Prunus armeniaca L. | 15 |
| Asparagus | Asparagus officinalis L. | 16 |
| Bambara Groundnut | Vigna subterranea (L.) Verdc. | 2 |
| Banana | Musa acuminata Colla and Musa balbisiana Colla | 6 |
| Barley | Hordeum vulgare L. | 4 |
| Bean | Phaseolus vulgaris L. | 6 |
| Beet | Beta vulgaris L. subsp. vulgaris L. | 14 |
| Black Mustard | Brassica nigra (L.) W. D. J. Koch | 6 |
| Breadfruit | Artocarpus altilis (Parkinson) Fosberg | 31 |
| Cabbage | Brassica oleracea L. | 24 |
| Cacao | Theobroma cacao L. | 1 |
| Carrot | Daucus carota L. | 21 |
| Cassava | Manihot esculenta Crantz subsp. esculenta Crantz | 135 |
| Cherry | Prunus avium (L.) L. | 21 |
| Chickpea | Cicer arietinum L. | 5 |
| Cocoyam | Xanthosoma sagittifolium (L.) Schott | 1 |
| Cotton | Gossypium hirsutum L. | 25 |
| Cowpea | Vigna unguiculata (L.) Walp. | 14 |
| Cucumber | Cucumis sativus L. | 2 |
| Eggplant | Solanum melongena L. | 58 |
| Faba Bean | Vicia faba L. | 1 |
| Finger Millet | Eleusine coracana (L.) Gaertn. | 6 |
| Garlic | Allium sativum L. | 1 |
| Grape | Vitis vinifera L. | 20 |
| Grapefruit | Citrus paradisi Macfad. | 8 |
| Grasspea | Lathyrus sativus L. | 5 |
| Groundnut | Arachis hypogaea L. | 16 |
| Leek | Allium porrum L. | 8 |
| Lemon | Citrus limon (L.) Burm. f. | 7 |
| Lentil | Lens culinaris Medik. | 5 |
| Lettuce | Lactuca sativa L. | 8 |
| Lima Bean | Phaseolus lunatus L. | 5 |
| Maize | Zea mays L. subsp. mays L. | 10 |
| Mango | Mangifera indica L. | 46 |
| Melon | Cucumis melo L. | 2 |
| Millet (Panicum) | Panicum miliaceum L. | 6 |
| Millet (Setaria) | Setaria italica (L.) P. Beauv. | 4 |
| Mung Bean | Vigna radiata (L.) Wilczek | 12 |
| Mustard | Brassica juncea (L.) Czern. | 4 |
| Oat | Avena sativa L. | 14 |
| Onion | Allium cepa L. | 3 |
| Orange | Citrus sinensis (L.) Osbeck | 12 |
| Papaya | Carica papaya L. | 8 |
| Pea | Pisum sativum L. | 5 |
| Peach | Prunus persica (L.) Batsch | 27 |
| Pear | Pyrus communis L. | 27 |
| Pearl Millet | Pennisetum glaucum (L.) R. Br. | 5 |
| Pepper | Capsicum annuum L. | 7 |
| Pigeon Pea | Cajanus cajan (L.) Millsp. | 16 |
| Pineapple | Ananas comosus (L.) Merr. | 5 |
| Plum | Prunus domestica L. | 18 |
| Potato | Solanum tuberosum L. | 79 |
| Pumpkin | Cucurbita maxima Duchesne | 3 |
| Quinoa | Chenopodium quinoa Willd. | 9 |
| Rape | Brassica napus L. | 12 |
| Rice | Oryza glaberrima Steud. and Oryza sativa L. | 20 |
| Rye | Secale cereale L. | 4 |
| Safflower | Carthamus tinctorius L. | 14 |
| Sorghum | Sorghum bicolor (L.) Moench | 17 |
| Soybean | Glycine max (L.) Merr. | 5 |
| Spinach | Spinacia oleracea L. | 2 |
| Strawberry | Fragaria x ananassa Duchesne ex Rozier | 17 |
| Sugarcane | Saccharum officinarum L. | 11 |
| Sunflower | Helianthus annuus L. | 38 |
| Sweet potato | Ipomoea batatas (L.) Poir | 14 |
| Tomato | Solanum lycopersicum L. | 12 |
| Turnip | Brassica rapa L. | 9 |
| Urd Bean | Vigna mungo var. mungo (L.) Hepper | 21 |
| Vetch | Vicia sativa L. | 9 |
| Water Yam | Dioscorea alata L. | 6 |
| Watermelon | Citrullus lanatus (Thunb.) Matsum. & Nakai. | 6 |
| Wheat | Triticum aestivum L. | 45 |
| White Guinea Yam | Dioscorea rotundata Poir. | 4 |
| Yellow Yam | Dioscorea cayennensis Lam. | 6 |
Figure 1. Final priority category results for all assessed crop wild relatives
Topping |
Slices |
| HPS | 763 |
| MPS | 145 |
| LPS | 130 |
| NFCR | 51 |
Of the 1,089 CWR species thus far analyzed, 763 (70%) were classified as High Priority Species (HPS) for further collection, 145 (13%) as Medium Priority Species (MPS), 130 (12%) as Low Priority Species (LPS), and only 51 (5%) as No Further Collecting Required (NFCR) (Fig. 1). See the bottom of this page for an explanation of the methodology and details on these categories.
Figure 2. Final priority category results for a selection of crop genepools
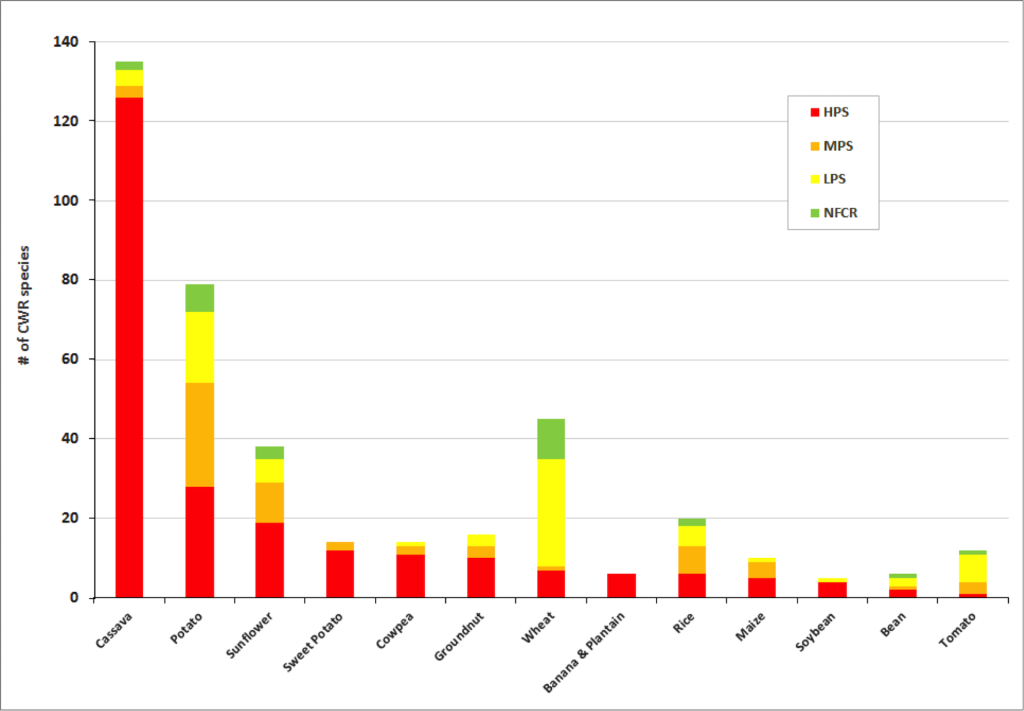 Significant gaps in collections are evident within the great majority of crop genepools . The percentage of high priority species for collecting per crop genepool reach up to 100% for banana and plantain, 88% for sorghum and 86% for sweet potato. Crop genepools displaying the greatest absolute number of high priority species in need of collecting include cassava, eggplant, mango, breadfruit, potato, almond, apple, and sunflower.
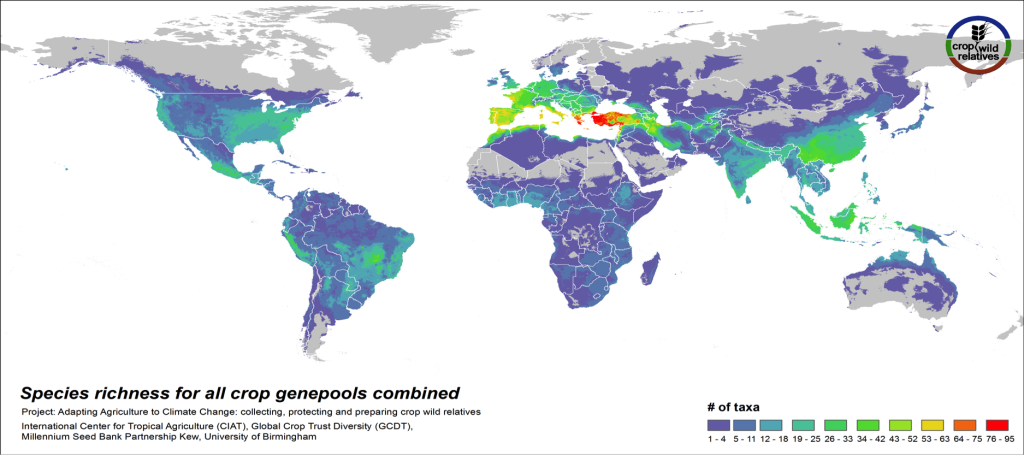
Figure 3. CWR species richness for all crop genepools combined
The global distribution of the CWR of the 81 assessed crop genepools is displayed in Fig 3. This species richness map displays the concentration of all assessed CWR species, regardless of final priority category. The yellow-orange-red regions indicate geographic areas where very large numbers of CWR species exist, which are largely in the traditionally recognized centers of crop genetic diversity i.e. the “Vavilov Centres”1 (see map2), particularly the Mediterranean and Near East. Significant richness of CWR is also seen in a number of regions that are not traditionally recognized as major centers of diversity, such as the eastern United States and northern Australia.
Figure 4. Collecting hotspots by crop genepool for all crop genepools combined
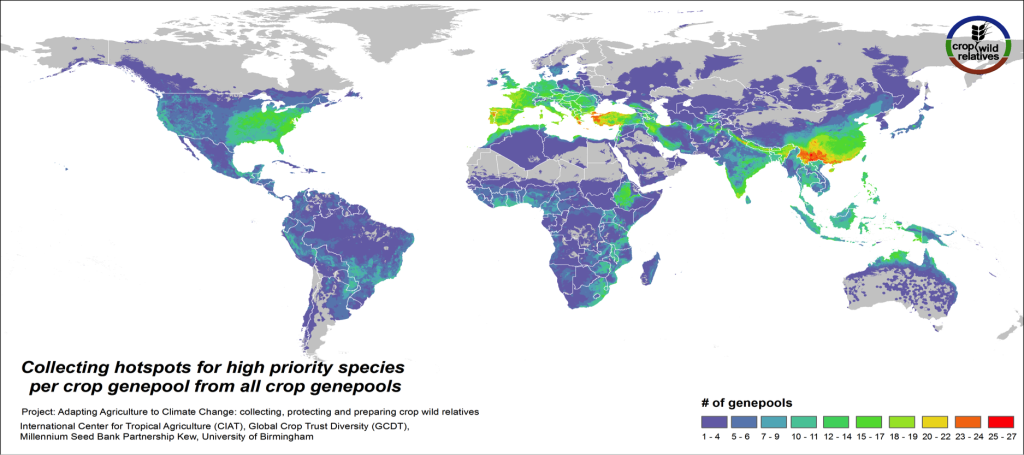 Figs. 4-5 illustrate the geographic regions around the world where the CWR of the assessed genepools are in greatest need of collecting. These collecting priorities hotspots maps display the concentration of areas considered gaps in genebank collections for high priority species. Collecting hotspots on the crop genepool level, i.e. the number of crop genepools that display gaps in any particular area, is shown in Fig. 4. The Mediterranean and the Near East, Europe, South, East and Southeast Asia, the eastern United States, and East to Southern Africa stand out as regions with a particularly rich number of crop genepools displaying gaps for high priority species.
Figure 5. Collecting hotspots of high priority species for all crop genepools combined
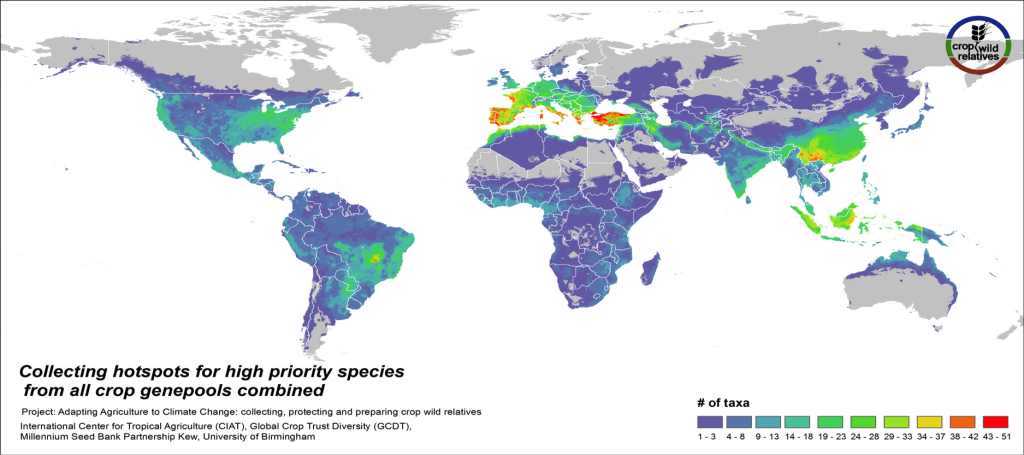 Fig. 5 displays collecting priorities hotspots at the species level, i.e. the number of high priority CWR species that are in need of collecting in any particular area. Particularly important areas for collecting of these CWR include the Mediterranean and the Near East, Europe, East and Southeast Asia, the United States, the Andes and Brazil, northern Australia, and West, East and Southern Africa.
Figure 6. Number of CWR species of high priority for collecting per country
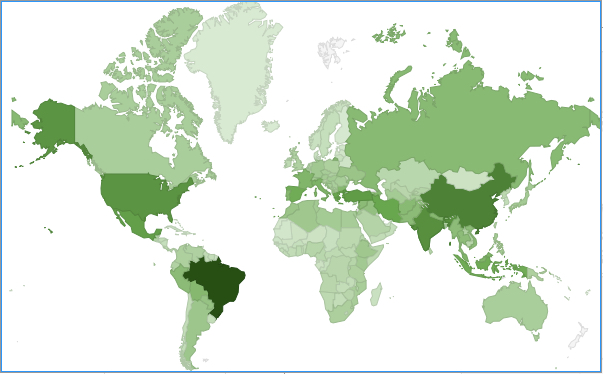
Countries with the greatest quantity of CWR species of high priority for further collecting include Brazil, China, India, the United States, Turkey, Mexico, Iran, Greece, Indonesia, and Spain (Fig. 6).
Figure 7. Relative differences between Final Priority Score and Mean Expert Priority Score per crop genepool for a selection of crop genepools
 Over 100 expert evaluations have been carried out for 81 crop genepools. These evaluations have been especially helpful in identifying CWR that are considered in need of further conservation by researchers, even though the gap analysis did not highlight these specific species. Diverse responses were obtained from experts per genepool. Overall accord between the gap analysis and comparable expert scores for a selection of crop genepools is displayed in Fig. 7. Good agreement between the Final Priority Score (FPS) estimated through the Gap Analysis and the mean Expert Priority Score (EPS) was found in crops such as pea, rice, lima bean, oat, vetch and eggplant.
Rice
Figure 8. Gap richness in high priority species for the rice genepool
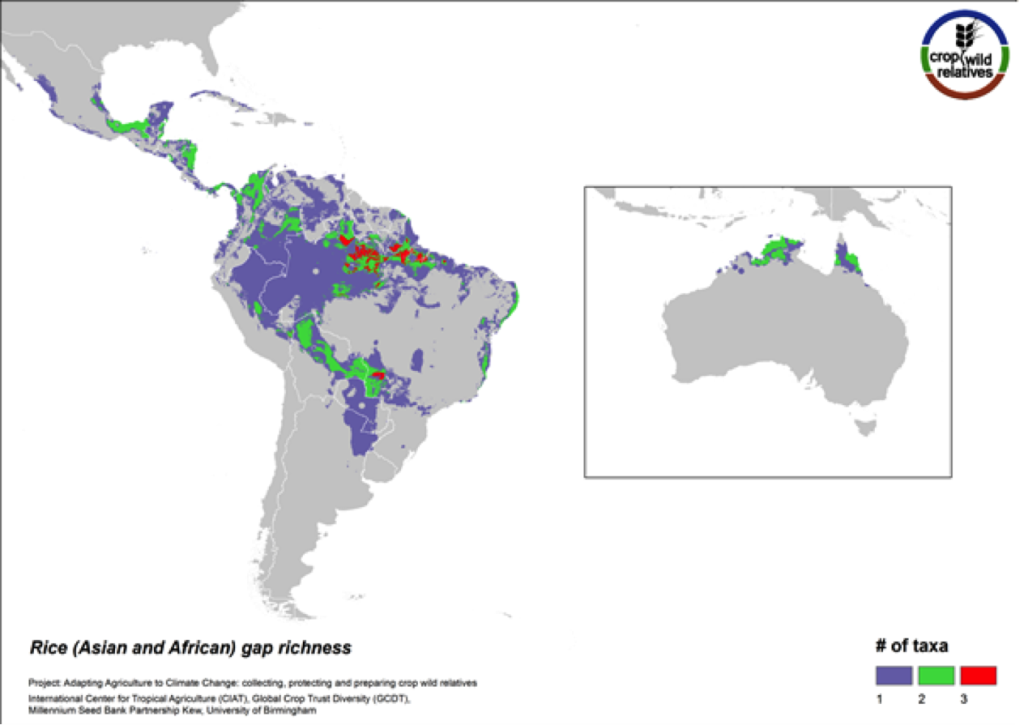
The pantropical rice genepool composed of 21 species is particularly species rich in South to Southeast Asia, West Africa, and northern South America. Seven (33%) of these species are designated as high priority for collecting. The regions with the greatest number of species requiring collecting are in South America and northern Australia.
Potato
Figure 9. Gap richness in high priority species for the potato genepool
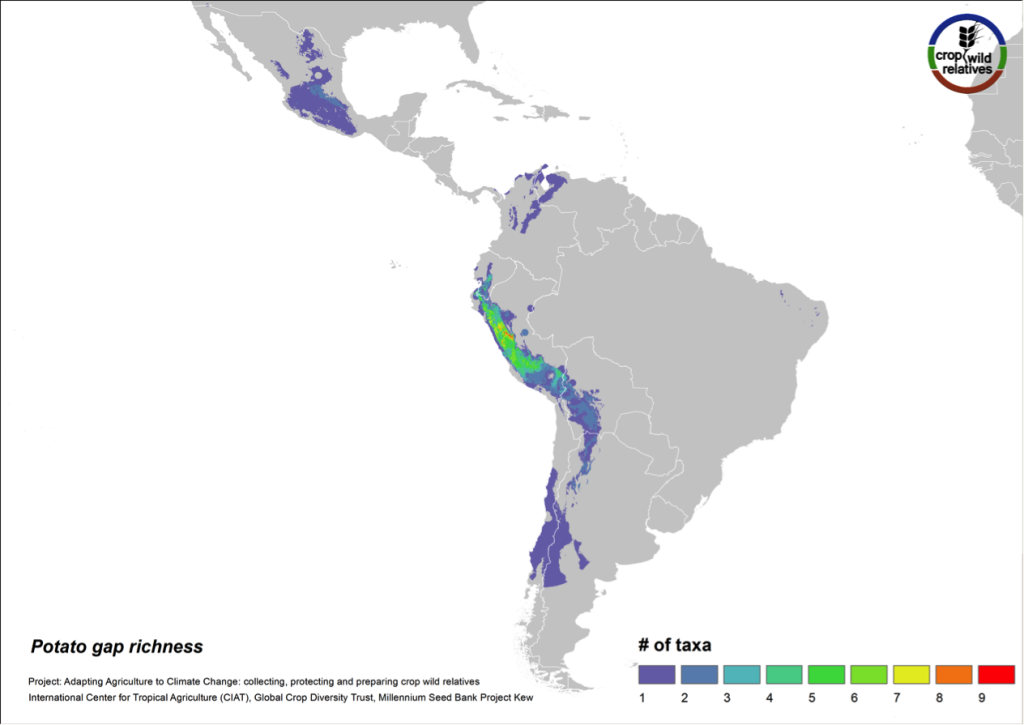
The 79 species related to potato are found in highest concentration in the central and northern Andes and in central Mexico. Collecting gaps persist throughout the geographic range of the genepool, but the 29 high priority species for collecting are concentrated in the north-central Andes, particularly in Peru (Fig. 9).
Pigeonpea
Figure 10. Gap richness in high priority species for the pigeonpea genepool
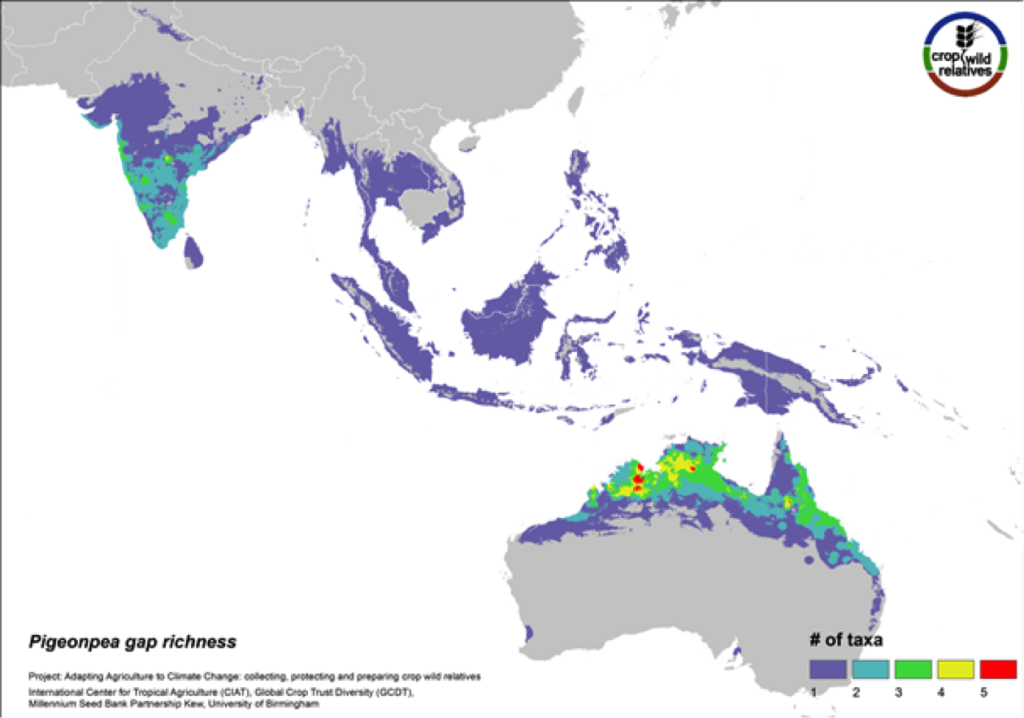
Pigeonpea is consumed both as a vegetable and a pulse in many semi-arid tropical and subtropical regions worldwide, particularly in India and East Africa. Pigeonpea’s 16 CWR are distributed in highest concentration in South Asia and in tropical northern Australia. These same regions are identified as in need of urgent collection (Fig. 10). 75% of the genepool is considered high priority for collecting.
Sunflower
Figure 11. Gap richness in high priority species for the sunflower genepool
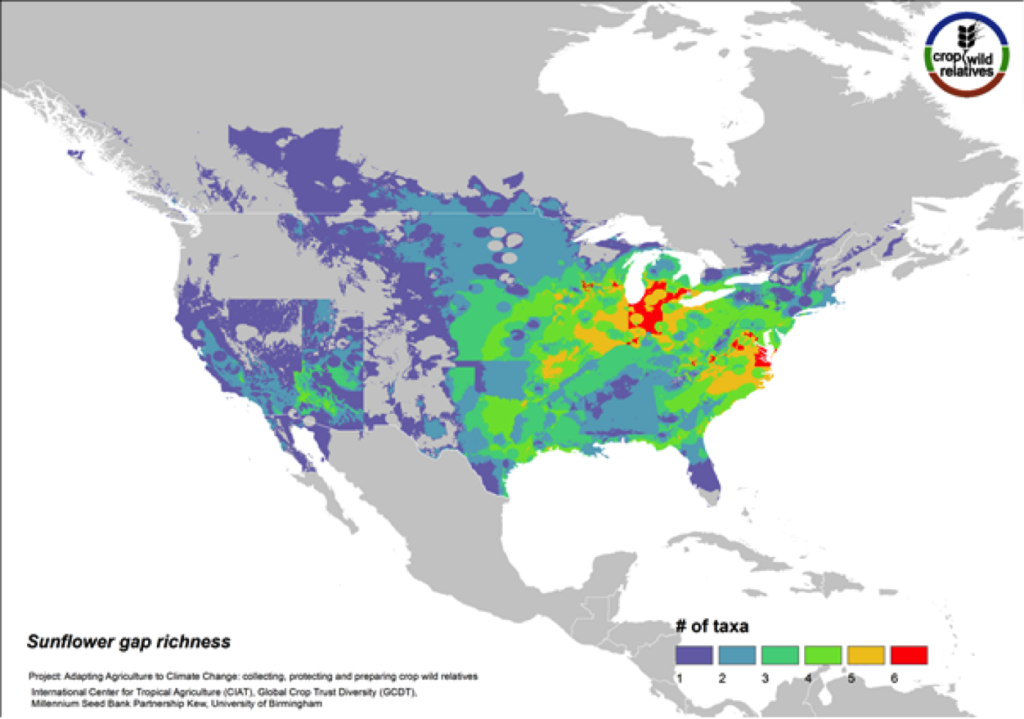
Although sunflower is widely known for its beauty and is planted worldwide as an ornamental, it is cultivated globally as an important seed and oil crop. The 38 assessed wild relatives of sunflower are concentrated in the eastern United States, and the most significant gaps in genebank collections for these species are concentrated in this same region (Fig. 11). Half of all sunflower CWR are considered high priority species for collecting.
Banana and Plantain
Figure 12. Gap richness in high priority species for the banana and plantain genepool
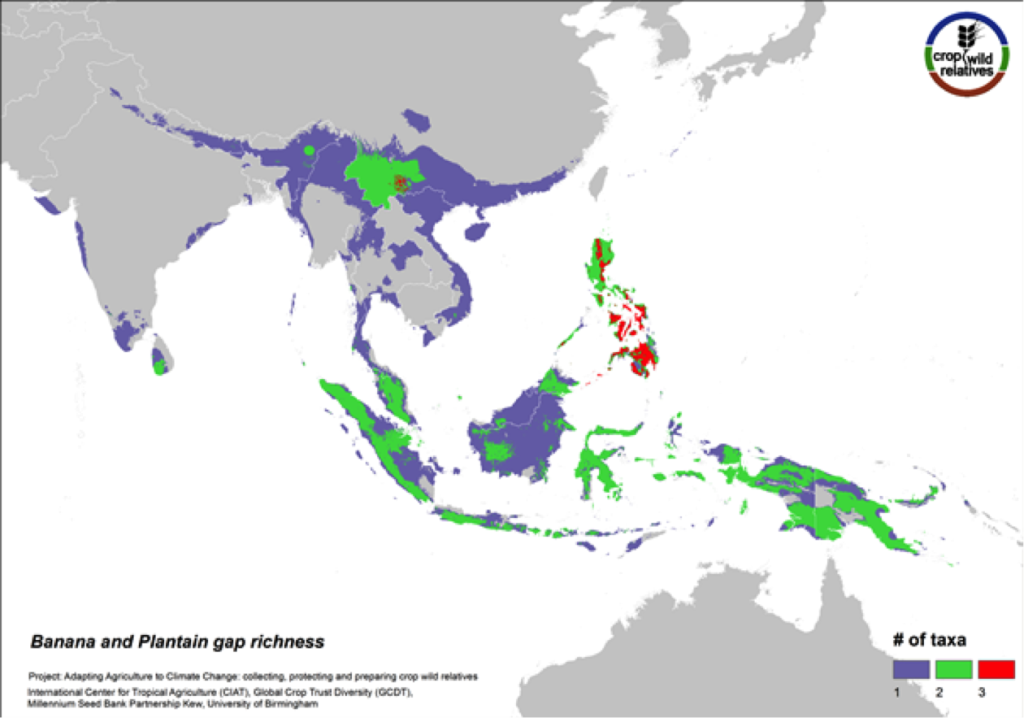
Sweet bananas and starchy plantains share the same wild relatives. Together these crops are cultivated in more than 130 countries, and are extremely important in East Africa and a number of other tropical regions. We assessed the wild relatives of these crops at the species level. The CWR species are distributed in Southeast Asia, particularly in the Philippines and in Southern China, and the gaps in collections for the six high priority species are concentrated in these same areas (Fig. 12).
Sorghum
Figure 13. Gap richness in high priority species for the sorghum genepool
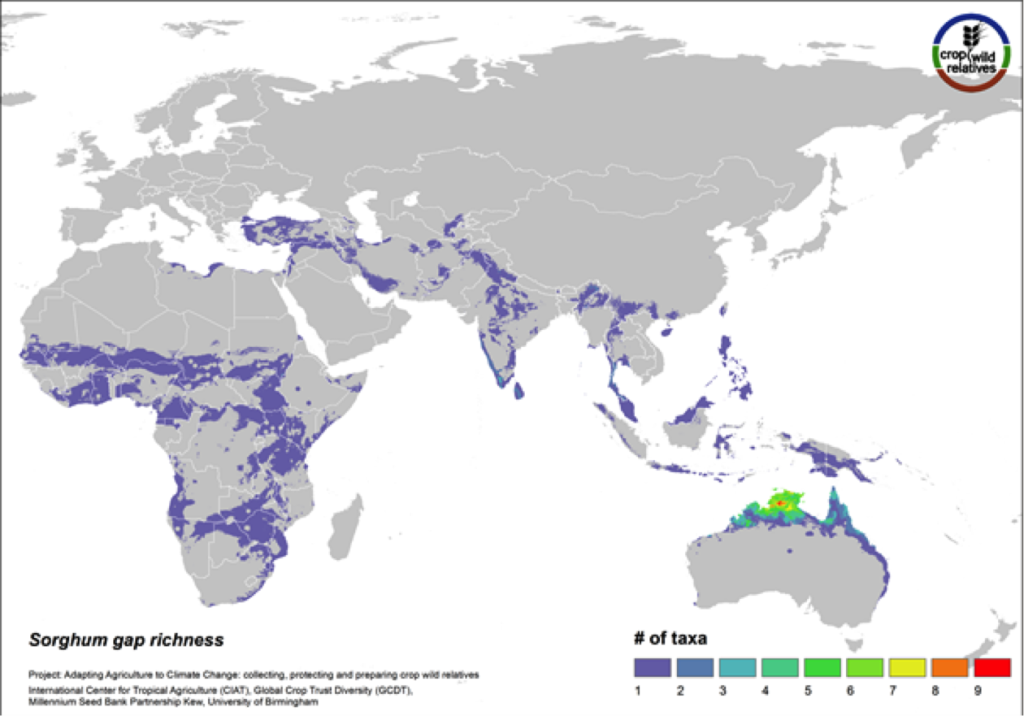
88% of the wild relatives of sorghum are considered high priority for collecting. The genepool is concentrated in tropical northern Australia and southern Africa, and the most significant area identified as in need of collecting is northern Australia (Fig. 13).
Sweet Potato
Figure 14. Gap richness in high priority species for the sweet potato genepool
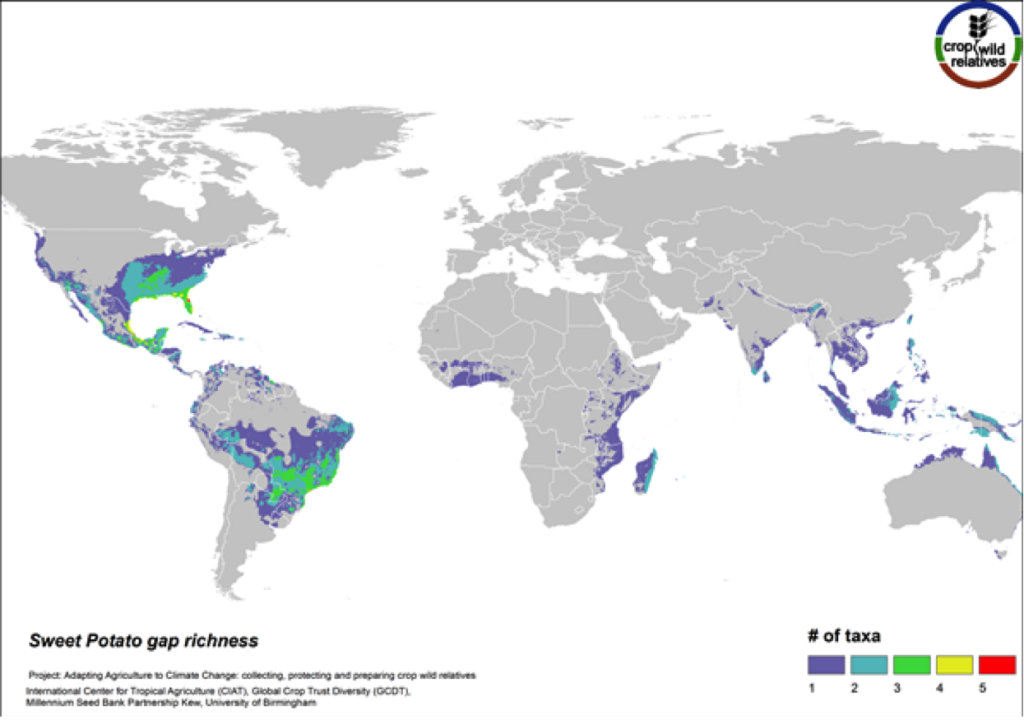
The 14 wild relatives of this important starchy root crop are concentrated in South America and in Central Mexico up into the southeastern United States. Areas identified for collecting the 12 high priority CWR species are distributed throughout this range (Fig. 14).
Pearl Millet
Figure 15. Gap richness in high priority species for the pearl millet genepool
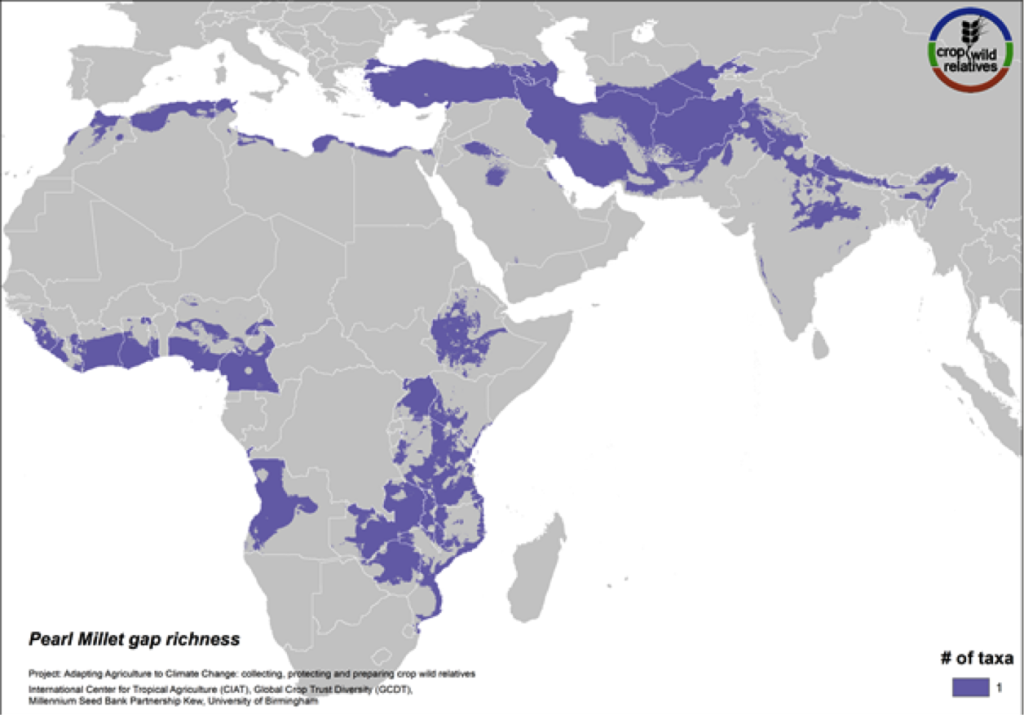
Pearl millet is a staple cereal grain that is very important to communities in the Sahel, East and southern Africa, and India. The crop is consumed in breads, porridges, boiled foods and beer, and can withstand both drought and high temperatures. The five wild relatives of pearl millet are distributed in East and West Africa, the Mediterranean and the Near and Middle East, and gaps in collections for the 4 high priority species persist throughout this range (Fig. 15).
Carrot
Figure 16. Gap richness in high priority species for the carrot genepool
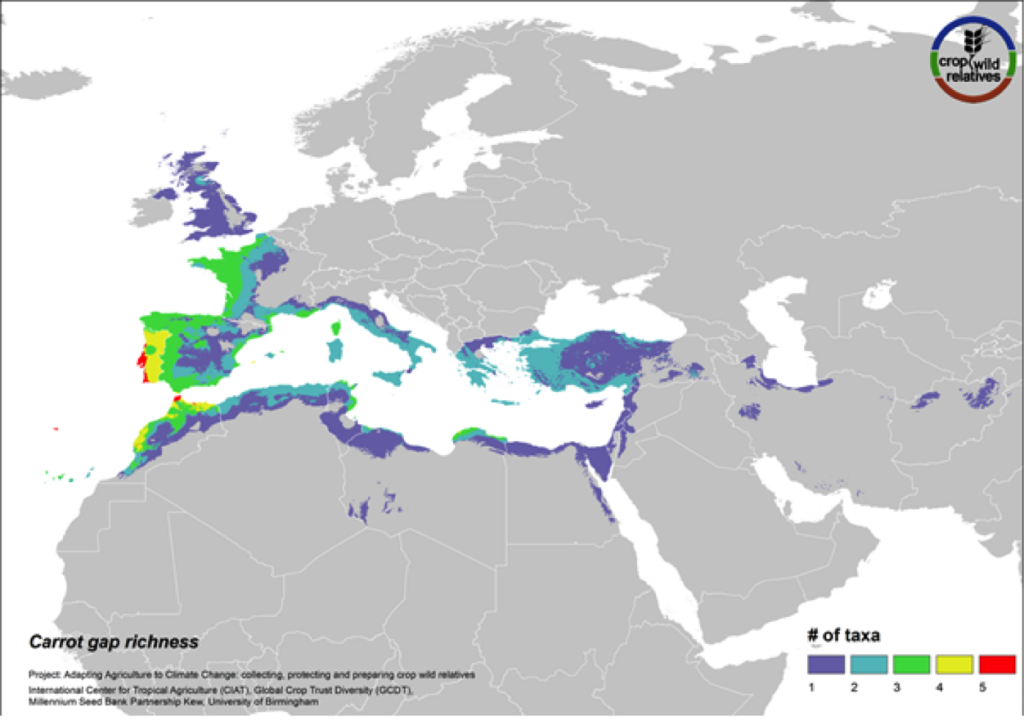
The wild relatives of carrot are distributed in the Mediterranean, Europe and the Middle East. 81% of carrot’s 21 wild relatives are considered of high priority for collecting. Geographic regions with the greatest need for collecting carrot CWR include the Western Mediterranean, Western Europe, and Cyprus (Fig. 16).
Finger Millet
Figure 17. Gap richness in high priority species for the finger millet genepool
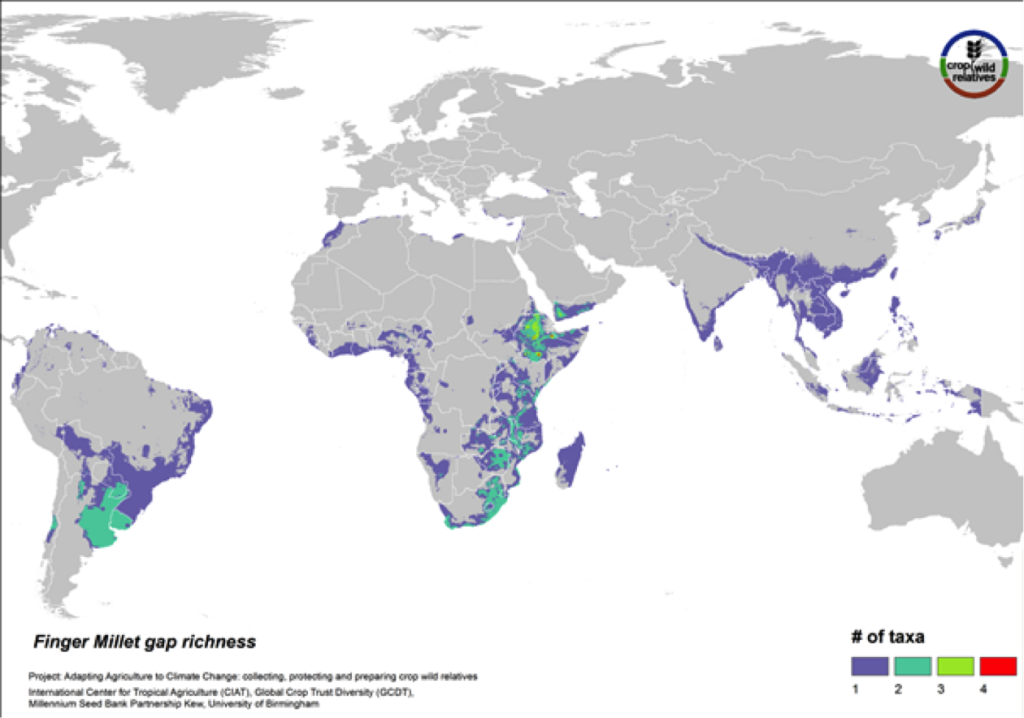
Finger millet is a drought tolerant crop cultivated in arid highland areas of East and southern Africa and South Asia. The pantropical genepool comprised of six CWR is concentrated in East and southern Africa, especially in Ethiopia. Geographic regions displaying the most significant gaps in collections for the five high priority species include these areas as well as South America (Fig. 17).
Methods and Resources
The gap analysis methodology relies on taxonomic, geographical, and environmental occurrence information, which is used to model the potential distribution of each CWR species of interest. The resulting modeled potential distribution is compared with the locations of previously collected CWR samples that are conserved and accessible in genebanks. Such a comparison permits the identification of CWR that are of particular priority due to being relatively under-represented in genebanks, as well as geographic locations that are of priority for collecting these particular species. The methodology also includes an expert evaluation step, in which researchers with knowledge of the conservation status and distribution of CWR in specific genepools are asked to analyze the gap analysis results.
The gap analysis methodology results in a final priority score (FPS) independently given to each CWR species analyzed. This score is derived from the average of three quantitative assessments utilized to estimate the comprehensiveness of germplasm collections for the species:
- Sampling Representativeness Score: estimates overall sufficiency of number of genebank accessions held;
- Geographical Representativeness Score: estimates the sufficiency of geographic coverage of genebank accessions in comparison to the overall potential distribution of the species;
- Environmental Representativeness Score: estimates the sufficiency of genebank accessions in comparison to the environmental diversity encompassed in the overall potential distribution of the species.
The final priority score (ranging from 0-10) is used to classify taxa into priority categories (Table 2). Those taxa assigned to the High Priority Species (HPS) category are of utmost concern and thus become the focus of the maps identifying collecting gaps for CWR species and for crop genepools.
Table 2: CWR final priority score categories
HPS |
MPS |
LPS |
NFCR |
| High Priority Species
Final priority score- between 0-3 |
Medium Priority Species
Final priority score- between 3.01-5 |
Low Priority Species
Final priority score- between 5.01-7.5 |
No Further Collecting is Required
Final priority score- between 7.51-10 |
The expert evaluation is carried out via an online survey evaluating both the numerical as well as the geographical results. In the first part, the expert is given a list of the CWR and asked to rate each species between 0-10 in regard to the priority for collecting for ex situ conservation, based solely on taxonomic (taxon-level) and geographic (population-level) gaps in genebank collections. This score can be directly compared to the gap analysis methodology final priority score (FPS). Second, the expert is asked for the same species to rate from 0-10 the priority for collection for ex situ conservation, based both on taxonomic and geographic gaps, as well as usefulness and threat (i.e. the expert’s whole perspective on what they would personally want to see collected). This second score serves as a useful addition for informing collecting priorities by adding known context from the experts. The expert is also asked to list any additional taxa that should be considered in such an analysis, and to identify any rare/endemic taxa on the list. The expert is then taken to a separate page and shown the numerical results of the gap analysis. The expert is asked to rate for each species their agreement with the FPS, on a scale of 1 (strongly disagree) to 5 (strongly agree). Finally, the expert is asked to rate the quality of the geographical data (occurrence points), species distribution models, and resulting collecting priorities maps.
For a detailed explanation of each step of the gap analysis methodology, please see our PLoS One article3. We hope that the methodology will be useful to researchers interested in investigating gaps in genebank collections for CWR and in refining collecting priorities for particular genepools, CWR and geographic regions. In order to facilitate this, the methodology utilizes openly available occurrence and environmental data and is processed with open access statistical packages written in R. We are providing the corresponding code for performing the gap analysis as well as detailed instructions for preparing and processing data.
We are making available over 5.3 million occurrence records that have been contributed by the world’s herbaria, genebanks, and researchers. This data will be made searchable and available through this website and well as via GBIF in 2014. Please contact us to request datasets.
Next Steps
The gap analysis results are being used to inform planning for collecting trips for priority CWR globally, led by national agricultural and botanical research institutions in collaboration with international partners and in accordance with the International Treaty on Plant Genetic Resources for Food and Agriculture.
References
1 Vavilov, N.I. 1926. Studies on the origin of cultivated plants. Bulletin of Applied Botany. Genet. Plant Breed. 16:1–248.
2 Maxted, N. et al., 2012. Toward the Systematic Conservation of Global Crop Wild Relative Diversity. Crop Science, 52(2), p.774. Available at:https://www.crops.org/publications/cs/abstracts/52/2/774
3 Ramírez-Villegas J, Khoury C, Jarvis A, Debouck DG, Guarino L (2010) A Gap Analysis Methodology for Collecting Crop Genepools: A Case Study with Phaseolus Beans. PLoS ONE 5(10): e13497. doi:10.1371/journal.pone.00134972df0b99d5a0f4730b8c5edb79d07b9ed. Available at:http://www.plosone.org/article/info%3Adoi%2F10.1371%2Fjournal.pone.0013497
